


BLS Issues Report on Worker Injuries
Report covers injuries to government and private industry workers by sector and occupation.
A new BLS (Bureau of Labor Statistics) Spotlight on Statistics reports focuses on injuries to workers. The scope of the Survey of Occupational Injuries and Illnesses was expanded with the 2008 survey to cover a more complete section of the U.S. economy: state and local government workers.
Prior to the publication of the 2008 survey results, data users commonly requested information about industries in the public sector. Estimates covering nearly 18.5 million state and local government workers show that these public sector employees experienced a higher incidence rate of work-related injuries and illnesses than their private industry counterparts.
This Spotlight on Statistics compares characteristics of injury and illness cases in state and local government with those in private industry, highlighting incidence rate trends in selected state and local government industries and examining injury and illness rates and cases that occurred in state and local government workplaces in 2011.
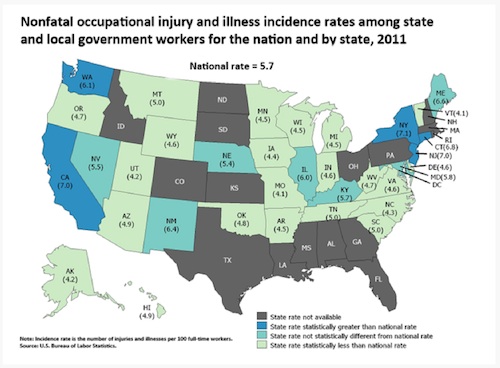
Nonfatal injury and illness rate greater than national average in five states
Among the 34 states for which data are available, the total recordable case injury and illness rates for state and local government were higher in 5 states than the national rate of 5.7 cases per 100 full-time workers. The rates were lower than the national rate in 22 states and not statistically different from the national rate in 7 states.
State-level public sector estimates were unavailable for 16 states and the District of Columbia for various reasons, such as lack of state funding or failure to meet BLS reliability criteria.
Among the states for which 2011 estimates are available, New York recorded an injury and illness incidence rate among state and local government workers of 7.1 cases per 100 full-time employees, which is statistically higher than the national rate.
By contrast, Missouri and Vermont each registered a rate of 4.1 cases, which was statistically lower than the national rate.
Some of these differences in incidence rates across states can be attributed to different industry composition among state and local government workers within each of the states.
State and local government workers accounted for about 22 percent of nonfatal injuries and illnesses
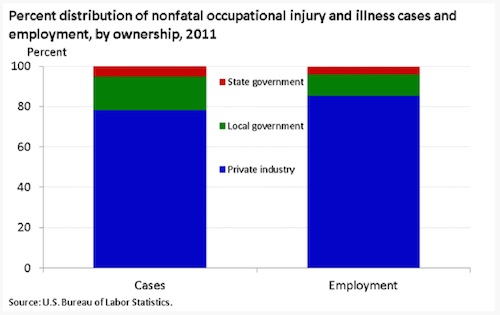
Although state and local government workers made up 14.6 percent of the employees covered by the Survey of Occupational Injuries and Illnesses in 2011, they accounted for 21.6 percent of the injury and illness cases that year. The difference was primarily driven by local government workers, who made up 10.8 percent of the employees covered by the survey but 16.8 percent of the injury and illness cases that occurred in 2011.
Violence made up 23.4 percent of injuries and illnesses with days away from work in state government
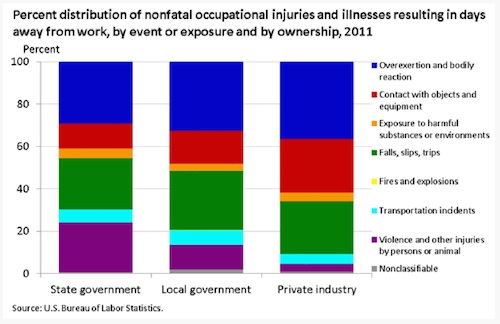
The 2011 estimates show that injuries and illnesses resulting in days away from work from overexertion and bodily reaction accounted for 32.9 percent (64,740) of all cases among local government workers, 29.3 percent (21,150) among state government workers, and 36.7 percent (329,910) among private industry workers.
Violence and other injuries by persons or animals accounted for 11.8 percent (21,130) of all cases among local government workers, 23.4 percent (16,880) among state government workers, and 3.7 percent (33,230) in private industry.
In state government, the 23.4 percent of cases that resulted from violence could possibly result from a higher concentration of state government workers in occupations that experienced high rates of violence, such as psychiatric aides.
Click here to download the complete report.
CONTRACTOR SUPPLY MAGAZINE


The April/May 2024 issue of Contractor Supply magazine is here!
This digital edition is sponsored by BECK AMERICA Inc.
Our cover story, Masters of Fasteners, visits Interstate Screw Corp. of metro Miami, which serves the fastening needs of south Florida, the Caribbean and Central and South America.
Also in this issue,our Industry Updates cover Adhesives, Tapes and Sealants, Anchoring Systems and Safety and PPE.
This digital edition is fully searchable and contains live links to every advertiser and new product listing. Click away!