


Are you making money?
Manage your good, bad and ugly inventory for maximum profitability.
 |
 |
I am going to begin this article with two assumptions which should be true for all companies with inventory to sell:
- You stock material to meet your customers’ expectations of product availability
- You are in business to make money
In this article we’re going to look at how the material you have in stock relates to these goals. That is, how it is helping you meet your customers’ expectations of availability while contributing positively to your company’s bottom line.
The Three Types of Stocked Inventory
Whether you are a manufacturer or distributor each piece of each item in your stocked inventory can fall into one of three categories:
The Good: The inventory that you stock that provides a positive return on your investment. That is, you make money when you sell the product.
The Bad: Inventory that doesn’t provide a return on your investment, but contributes to other profitable sales. For example, you might have to stock a line of slow moving repair parts to support the sales of other, hopefully very profitable, products. “Bad” inventory is a necessary evil. It is not an investment but an expense. That is, it is an expense of doing business.
The Ugly: Inventory that doesn’t provide a return on your investment, and doesn’t contribute to profitable sales. If you’re in business to make money, there is no reason for this stuff to be in your warehouse. Refer to some of our other articles for advice on liquidating your inventory of this material.
Your first step in analyzing the profitability of your inventory investment is to place each item you stock into one of these three categories. But to do this, we must determine when a product contributes to corporate profitability. That is, what inventory falls into the “good” category.
Defining Profitability
How does the typical distributor or manufacturer define profit? Well, if you ask someone in the sales department, they’ll probably talk to you about his or her company’s gross margin:
The higher gross margin, the better. Under most circumstances salespeople would rather sell a product with a 24% margin than an item with a 20% margin. Why? Because most salespeople are paid or judged based on gross margin. But does the company get a better return on investment on the product with a 24% margin? Maybe, maybe not. It depends on the average value of inventory the company must maintain to
generate the sales of the item.
The average inventory investment will depend on such factors as:
- Cost of the item
- Variations in customer demand
- Reliability of the vendor and method of transport
- Quantities that must be purchased in order to sell the item at a competitive price
The higher the average inventory investment, the more it costs you to maintain or “carry” the inventory in your warehouse. What expenses do incur in carrying inventory?
- Approximately 25% of the material handling expense. Seventy-five percent of material handling expense is typically associated with filling customer orders.
- Approximately 25% of rent and utilities. Again, the remaining 75% of warehouse activity is normally associated with filling customer orders.
- Insurance and taxes on inventory. If it’s in your warehouse you have to insure it, and it may be subject to tax.
- Physical inventory and cycle counting. The more material in your warehouse, the longer it takes to count.
- Inventory shrinkage and obsolescence. The more material in your warehouse, the higher the possibility of shrinkage and obsolescence. After all, it’s hard to steal something that isn’t there! And stuff you don’t buy can’t become dead stock!
- Opportunity cost of the money invested in inventory. How much could you make if you were to take the money you’re investing in inventory and invest it elsewhere?
Typically the carrying cost of finished goods inventory is 16% - 23% per year of the average inventory value (go to the carrying cost section of our Web site,
www.EffectiveInventory.com for information on calculating your company’s specific carrying cost).
With this fact in mind, does a product with a gross margin of 24% contribute more to a company’s bottom line that another product with a gross margin of only 20%? Let’s look at an example:
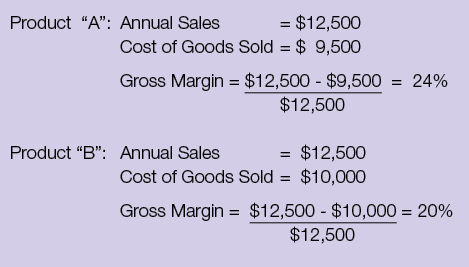
At first look, item “A” contributes more to the company’s profitability. But, what the gross margin doesn’t reflect is that we have to maintain an average inventory of $5,000 of item “A” and $1,000 of item “B.” If we subtract the yearly cost of maintaining this average inventory investment from the annual profit dollars (i.e. sales – cost), the result is a new measure of profitability, the adjusted margin:
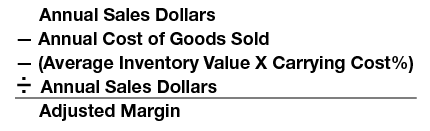
Let’s look at the adjusted margin of our two products:
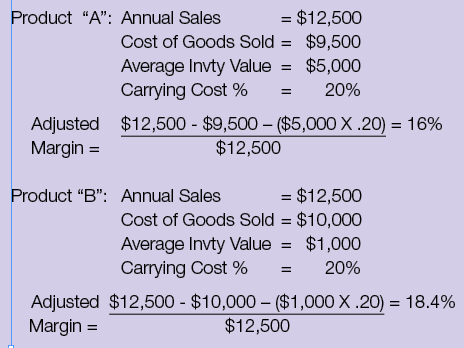
Even though product “B” has a lower gross margin, its higher adjusted margin (18.4%) shows that it contributes more to the company’s profitability.
You may be asking yourself, “but how do we know if the company is making money?” The answer is actually fairly simple. You compare the adjusted margin to percentage of “non-inventory related expenses,” or NIREP. The NIREP is calculated with this formula:
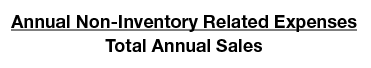
Annual non-inventory related expenses include all of the expenses you incur other than what was included in the carrying cost. This includes all selling, marketing and administrative costs. Every expense from your profit and loss statement should be included in either the carrying cost or NIREP. If your adjusted margin is 14% and your NIREP is 7%, you’re making money.
If your NIREP is higher than your adjusted margin, you’re looking at either “bad” or “ugly” inventory. Please don’t confuse the NIREP with the operating expense as a percentage of sales. That measurement includes the expenses that make up the carrying cost of inventory.
You can use the Adjusted Margin — NIREP comparison to gauge profitability throughout your organization. For example:
- The profitability of a branch. Compare the adjusted margin for the branch to the NIREP calculated for that branch.
- The profitability of a product line. Compare the adjusted margin for the product line to the NIREP calculated for the company.
- The profitability of a customer for whom you maintain consigned inventory. Compare the adjusted margin for the customer (profit for the customer and the cost of maintaining the consigned inventory) to the NIREP for the company.
If an item or product line’s adjusted margin doesn’t exceed the NIREP for the company, someone had better be able to prove that, even though the material doesn’t directly contribute to the bottom line, it contributes to other profitable sales. That is, it is bad but not ugly inventory.
The Adjusted Margin — NIREP comparison is a great tool for separating your good, bad and ugly inventory. Start using it today! CS
Jon Schreibfeder is president of Effective Inventory Management, Inc. He has authored numerous articles and several books on inventory management best practices and is the designated inventory management consultant for STAFDA. Jon can be reached at 972-304-3325 or by e-mail at info@effectiveinventory.com
CONTRACTOR SUPPLY MAGAZINE


The June/July 2026 issue of Contractor Supply magazine is here!
In our cover story, Service Over Scale, Idaho Tool in Nampa, Idaho follows a philosphy of immediacy, expertise, and advocacy through 40 years of change and success.
Also in this issue are Industry Updates.
This digital edition, sponsored by BECK AMERICA Inc., is fully searchable and contains live links to every advertiser and new product listing. Click away!
| Read the Articles Read the Digital Edition |