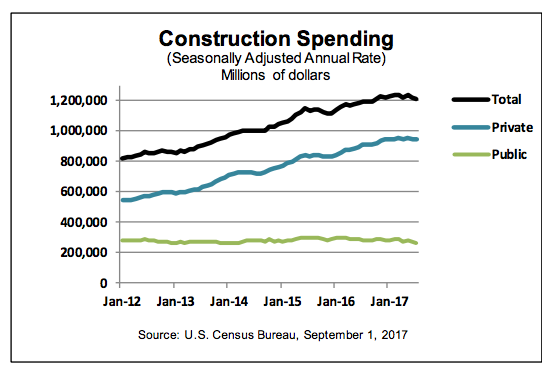
U.S. construction spending coasts in July
All sectors trend slightly down or level for the month.
 The U.S. Census Bureau announced the following value put in place construction statistics for July 2017:
Total Construction
Construction spending during July 2017 was estimated at a seasonally adjusted annual rate of $1,211.5 billion, 0.6 percent (±1.5 percent)* below the revised June estimate of $1,219.2 billion. The July figure is 1.8 percent (±1.8 percent)* above the July 2016 estimate of $1,189.8 billion.
During the first 7 months of this year, construction spending amounted to $691.2 billion, 4.7 percent (±1.3 percent) above the $659.9 billion for the same period in 2016.
Private Construction
Spending on private construction was at a seasonally adjusted annual rate of $945.5 billion, 0.4 percent (±1.0 percent)* below the revised June estimate of $949.4 billion.
Residential construction was at a seasonally adjusted annual rate of $517.5 billion in July, 0.8 percent (±1.3 percent)* above the revised June estimate of $513.2 billion.
Nonresidential construction was at a seasonally adjusted annual rate of $428.0 billion in July, 1.9 percent (± 1.0 percent) below the revised June estimate of $436.2 billion.
Public Construction
In July, the estimated seasonally adjusted annual rate of public construction spending was $266.0 billion, 1.4 percent (±2.6 percent)* below the revised June estimate of $269.8 billion.
Educational construction was at a seasonally adjusted annual rate of $66.2 billion, 4.4 percent (±3.9 percent) below the revised June estimate of $69.2 billion.
Highway construction was at a seasonally adjusted annual rate of $84.8 billion, 0.1 percent (±6.9 percent)* above the revised June estimate of $84.7 billion.


