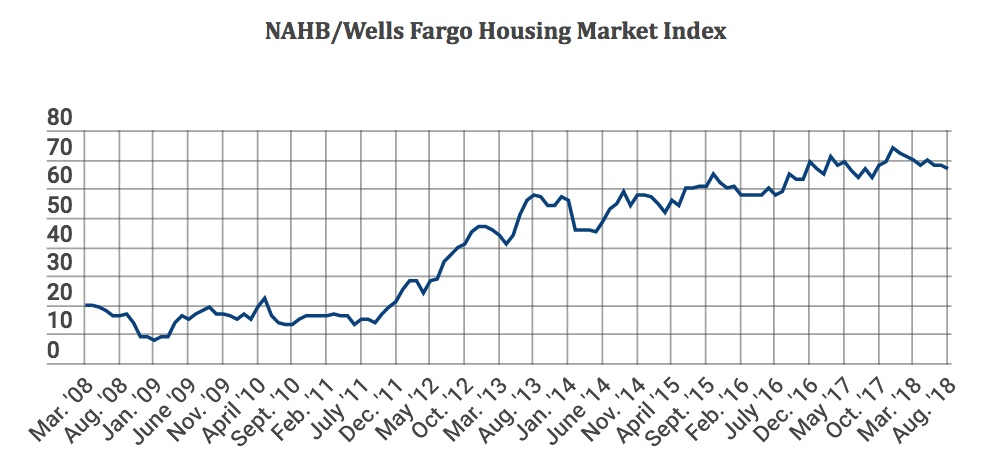
NAHB: Builder confidence remains firm in August
However, headwinds include rising construction costs, shortages of skilled labor and a dearth of buildable lots.
Builder confidence in the market for newly built single-family homes edged down one point to a solid 67 reading in August on the NAHB/Wells Fargo Housing Market Index.

“The good news is that builders continue to report strong demand for new housing, fueled by steady job and income growth along with rising household formations,” said NAHB chairman Randy Noel. “However, they are increasingly focused on growing affordability concerns, stemming from rising construction costs, shortages of skilled labor and a dearth of buildable lots.”
“The solid economic expansion and firm job market should spur demand for new single-family homes in the months ahead,” said NAHB chief economist Robert Dietz. “Meanwhile, builders continue to monitor how tariffs and the growing threat of a trade war are affecting key building material prices, including lumber. These cost increases, coupled with rising interest rates, are putting upward pressure on home prices and contributing to growing affordability challenges, as indicated by the latest quarterly reading of the NAHB/Wells Fargo Housing Opportunity Index.”
Derived from a monthly survey that NAHB has been conducting for 30 years, the HMI gauges builder perceptions of current single-family home sales and sales expectations for the next six months as “good,” “fair” or “poor.”
The survey also asks builders to rate traffic of prospective buyers as “high to very high,” “average” or “low to very low.” Scores for each component are then used to calculate a seasonally adjusted index where any number over 50 indicates that more builders view conditions as good than poor.
The HMI index measuring current sales conditions inched one point lower to 73 while the component gauging expectations in the next six months all fell a single point to 72. Meanwhile, the metric charting buyer traffic dropped two points to 49.
Looking at the three-month moving averages for regional HMI scores, the South and West each held steady at 70 and 75, respectively. The Northeast fell three points to 54 and the Midwest also posted a three-point decline to stand at 62.
HMI tables can be found at nahb.org/hmi. For more analysis, read the Eye on Housing blog post.


