


U.S. Housing Activity Continues Slide in October
Single-family permits dip 3.6 percent for month; starts fall 6.1 percent.
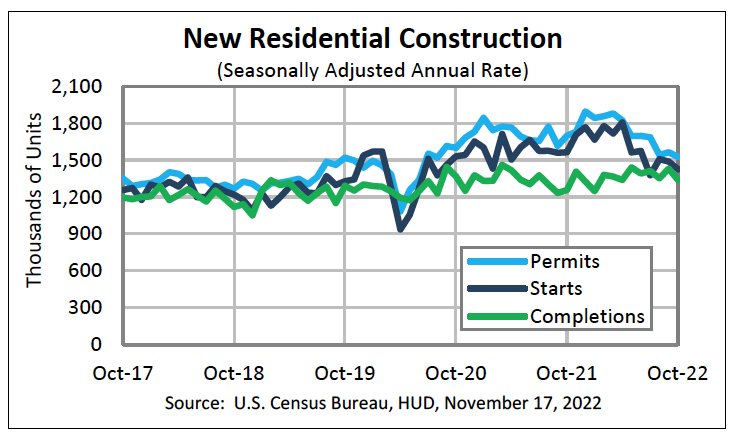 The U.S. Census Bureau and the U.S. Department of Housing and Urban Development jointly announced the following new residential construction statistics for October 2022:
Building Permits
Privately‐owned housing units authorized by building permits in October were at a seasonally adjusted annual rate of 1,526,000. This is 2.4 percent below the revised September rate of 1,564,000 and is 10.1 percent below the October 2021 rate of 1,698,000.
Single‐family authorizations in October were at a rate of 839,000; this is 3.6 percent below the revised September figure of 870,000. Authorizations of units in buildings with five units or more were at a rate of 633,000 in October.
Housing Starts
Privately‐owned housing starts in October were at a seasonally adjusted annual rate of 1,425,000. This is 4.2 percent (±12.7 percent)* below the revised September estimate of 1,488,000 and is 8.8 percent (±12.7 percent)* below the October 2021 rate of 1,563,000.
Single‐family housing starts in October were at a rate of 855,000; this is 6.1 percent (±13.4 percent)* below the revised September figure of 911,000. The October rate for units in buildings with five units or more was 556,000.
Housing Completions
Privately‐owned housing completions in October were at a seasonally adjusted annual rate of 1,339,000. This is 6.4 percent (±10.6 percent)* below the revised September estimate of 1,431,000, but is 6.6 percent (±12.6 percent)* above the October 2021 rate of 1,256,000.
Single‐family housing completions in October were at a rate of 961,000; this is 8.3 percent (±8.2 percent) below the revised September rate of 1,048,000. The October rate for units in buildings with five units or more was 362,000.
CONTRACTOR SUPPLY MAGAZINE


The April/May 2026 issue of Contractor Supply magazine is here!
In our cover story, Precision Over Volume, Tool Factory Outlet of Goshen, New York is a contractor supply operation built on niche brands and technical expertise.
Take a look back at World of Concrete 2026. Also in this issue are Industry Updates.
This digital edition, sponsored by BECK AMERICA Inc., is fully searchable and contains live links to every advertiser and new product listing. Click away!
| Read the Articles Read the Digital Edition |