
U.S. Residential Market Slides in November
Single‐family permits slide 7.1 percent for month; completions rise 9.5 percent.
 |
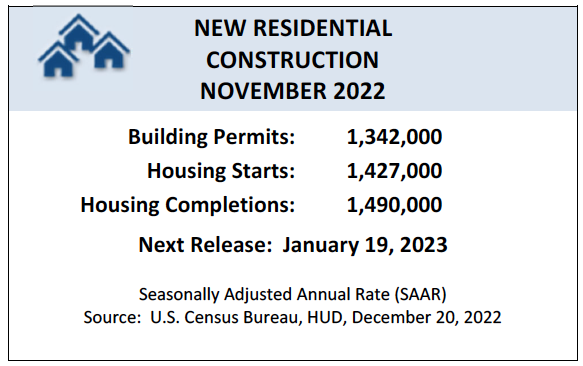 |
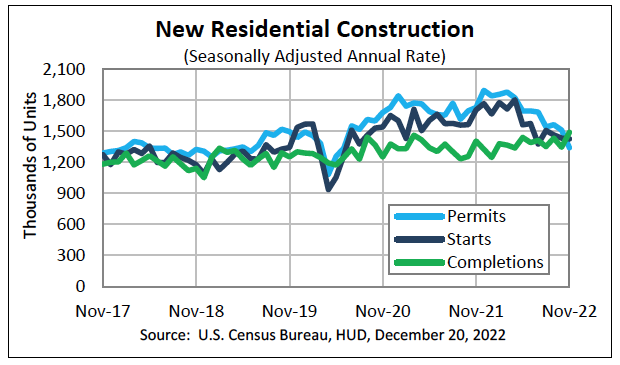
The U.S. Census Bureau and the U.S. Department of Housing and Urban Development jointly announced the following new residential construction statistics for November 2022:
Building Permits
Privately‐owned housing units authorized by building permits in November were at a seasonally adjusted annual rate of 1,342,000. This is 11.2 percent below the revised October rate of 1,512,000 and is 22.4 percent below the November 2021 rate of 1,729,000.
Single‐family authorizations in November were at a rate of 781,000; this is 7.1 percent below the revised October figure of 841,000. Authorizations of units in buildings with five units or more were at a rate of 509,000 in November.
Housing Starts
Privately‐owned housing starts in November were at a seasonally adjusted annual rate of 1,427,000. This is 0.5 percent (±12.3 percent)* below the revised October estimate of 1,434,000 and is 16.4 percent (±13.4 percent) below the November 2021 rate of 1,706,000.
Single‐family housing starts in November were at a rate of 828,000; this is 4.1 percent (±11.3 percent)* below the revised October figure of 863,000. The November rate for units in buildings with five units or more was 584,000.
Housing Completions
Privately‐owned housing completions in November were at a seasonally adjusted annual rate of 1,490,000. This is 10.8 percent (±15.8 percent)* above the revised October estimate of 1,345,000 and is 6.0 percent (±17.6 percent)* above the November 2021 rate of 1,406,000.
Single‐family housing completions in November were at a rate of 1,047,000; this is 9.5 percent (±12.9 percent)* above the revised October rate of 956,000. The November rate for units in buildings with five units or more was 430,000.
CONTRACTOR SUPPLY MAGAZINE


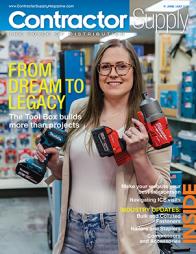
The June/July 2025 issue of Contractor Supply magazine is here!
Our cover story,From Dream to Legacy, Jill Tranmer always wanted to have her own business. She never imagined it would be a tool and bearing sales distribution business. Follow her journey at bringing her family together at the Tool Box in Great Falls, Montana.
Also in this issue are Industry Updates on Bulk and Collated Fasteneres; Nailers and Staplers; and Compressors and Accessories.
This digital edition, sponsored by BECK AMERICA Inc., is fully searchable and contains live links to every advertiser and new product listing. Click away!
| Read the Articles Read the Digital Edition |