U.S. Construction Spending Ticks Up 0.5% in August
August figure trends 7.4 percent above August 2022.
 The U.S. Census Bureau announced the following value put in place construction statistics for August 2023:
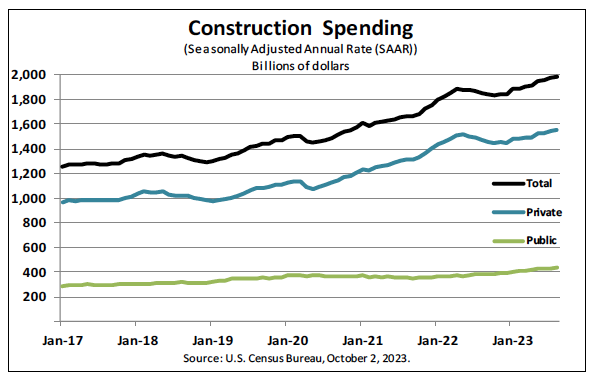
Total Construction
Construction spending during August 2023 was estimated at a seasonally adjusted annual rate of $1,983.5 billion, 0.5 percent (±1.2 percent)* above the revised July estimate of $1,973.7 billion. The August figure is 7.4 percent (±1.8 percent) above the August 2022 estimate of $1,847.3 billion.
During the first eight months of this year, construction spending amounted to $1,284.7 billion, 4.2 percent (±1.2 percent) above the $1,233.4 billion for the same period in 2022.
Private Construction
Spending on private construction was at a seasonally adjusted annual rate of $1,551.8 billion, 0.5 percent (±0.7 percent)* above the revised July estimate of $1,544.6 billion.
Residential construction was at a seasonally adjusted annual rate of $879.9 billion in August, 0.6 percent (±1.3 percent)* above the revised July estimate of $874.7 billion.
Nonresidential construction was at a seasonally adjusted annual rate of $671.9 billion in August, 0.3 percent (±0.7 percent)* above the revised July estimate of $669.9 billion.
Public Construction
In August, the estimated seasonally adjusted annual rate of public construction spending was $431.6 billion, 0.6 percent (±2.1 percent)* above the revised July estimate of $429.1 billion.
Educational construction was at a seasonally adjusted annual rate of $90.6 billion, 0.2 percent (±3.5 percent)* above the revised July estimate of $90.4 billion.
Highway construction was at a seasonally adjusted annual rate of $130.4 billion, 0.4 percent (±5.1 percent)* above the revised July estimate of $130.0 billion.


