


U.S. Housing Permits Edge Up in October
But starts and completions show mixed signals.
 The U.S. Census Bureau and the U.S. Department of Housing and Urban Development jointly announced the following new residential construction statistics for October 2023:
Building Permits
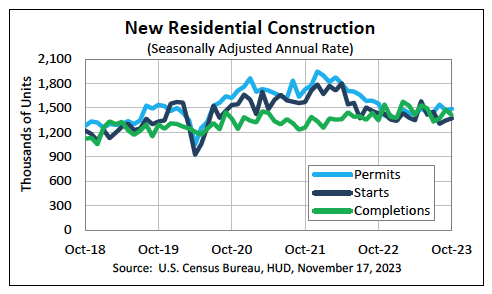
Privately‐owned housing units authorized by building permits in October were at a seasonally adjusted annual rate of 1,487,000. This is 1.1 percent above the revised September rate of 1,471,000, but is 4.4 percent below the October 2022 rate of 1,555,000.
Single‐family authorizations in October were at a rate of 968,000; this is 0.5 percent above the revised September figure of 963,000. Authorizations of units in buildings with five units or more were at a rate of 469,000 in October.
Housing Starts
Privately‐owned housing starts in October were at a seasonally adjusted annual rate of 1,372,000. This is 1.9 percent (±13.5 percent)* above the revised September estimate of 1,346,000, but is 4.2 percent (±10.0 percent)* below the October 2022 rate of 1,432,000.
Single‐family housing starts in October were at a rate of 970,000; this is 0.2 percent (±8.8 percent)* above the revised September figure of 968,000. The October rate for units in buildings with five units or more was 382,000.
Housing Completions
Privately‐owned housing completions in October were at a seasonally adjusted annual rate of 1,410,000. This is 4.6 percent (±11.6 percent)* below the revised September estimate of 1,478,000, but is 4.6 percent (±13.2 percent)* above the October 2022 rate of 1,348,000.
Single‐family housing completions in October were at a rate of 993,000; this is 0.9 percent (±12.3 percent)* below the revised September rate of 1,002,000. The October rate for units in buildings with five units or more was 408,000.
CONTRACTOR SUPPLY MAGAZINE


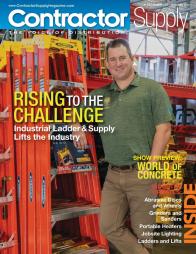
The December 2025/January 2026 issue of Contractor Supply magazine is here!
Our cover story, Rising to the Challenge, Industrial Ladder & Supply in Villa Park, Ill. uses a classic service model to keep climbing the ladder of success.
Learn what happened at the 2025 STAFDA Convention and Trade Show, get a preview of World of Concrete 2026. Also in this issue are Industry Updates.
This digital edition, sponsored by BECK AMERICA Inc., is fully searchable and contains live links to every advertiser and new product listing. Click away!
| Read the Articles Read the Digital Edition |